A Kestrel Analytics to Detect Lateral Movement
February 27, 2023
Machine Readable Representation of Adversary Behavior (video)
May 10, 2023In my previous blog post, I introduced a Kestrel analytics to detect lateral movement using clustering sources, destinations, and users and deriving inter-cluster authentication paths. In this blog post, I introduce a new Kestrel analytics which detects lateral movement using graph learning. This Kestrel analytics is developed by my colleague, Dr. Mahdi Rabbani and I at the Canadian Institute for Cybersecurity.
Why graph learning?
Graph learning refers to analysis of graph to learn the structure of graph and particularly node embeddings. Embedding of a node is a numeric vector and is considered as a feature vector representing that node. To detect malicious remote authentication requests, it is important to analyze the patterns of the authentication events in which a user or host were involved. For instance, it is important to consider the set of users that have requested to access a host or the set of hosts that are requested from a host. This information can be represented in a graph, defined as follows.
- Per each user or host, there is a node that represents that user or host.
- If an authentication request has been submitted by a user to access a host, there is an edge directed from the node representing the user to the node representing that host.
- If an authentication request has been submitted by a user from a host, there is an edge directed from the node representing that host to the node representing the user.
For instance, assume there is a network with five hosts, called C17693, C151, C1495, C1521, and C305, and three users whose usernames are U748, U636, and U1723. Fig. 1 represents a graph constructed based on the following authentication requests:
- Req 1: User U748 requests to access host C305 from host C17693.
- Req 2: User U748 requests to access host C305 from host C151.
- Req 3: User U636 requests to access host C305 from host C1495.
- Req 4: User U1723 requests to access host C305 from host C1521.

Using graph learning, we can analyze the connections between different users and hosts and the paths consisting of subsequent remote accesses that show the reachable hosts. The output of graph learning is an embedding vector for each node and edge of the graph, which can be used to differentiate the normal and malicious authentication requests.
Overview of the Machine Learning Approach
The machine learning approach implemented in this Kestrel analytics is supervised and consists of three phases, as follows.
- Phase 1: Building Graph
- Phase 2: Graph Learning
- Phase 3: Training Classifier
In Phase 1, a graph is constructed based on all available authentication events, regardless of if they are malicious or normal, as explained in the previous section. In Phase 2, our Kestrel analytics derives a vector of 128 elements for each node using node embedding techniques. These vectors and time of authentication requests are used to generate a feature vector for each requests. Phase 3 is the last phase which is dedicated to training a classifier. Currently, five classifiers can be applied using this Kestrel analytics, namely, SVM, logistic regression, KNN, XGBoost, and random forest.
Providing Data about Authentication Requests in Kestrel
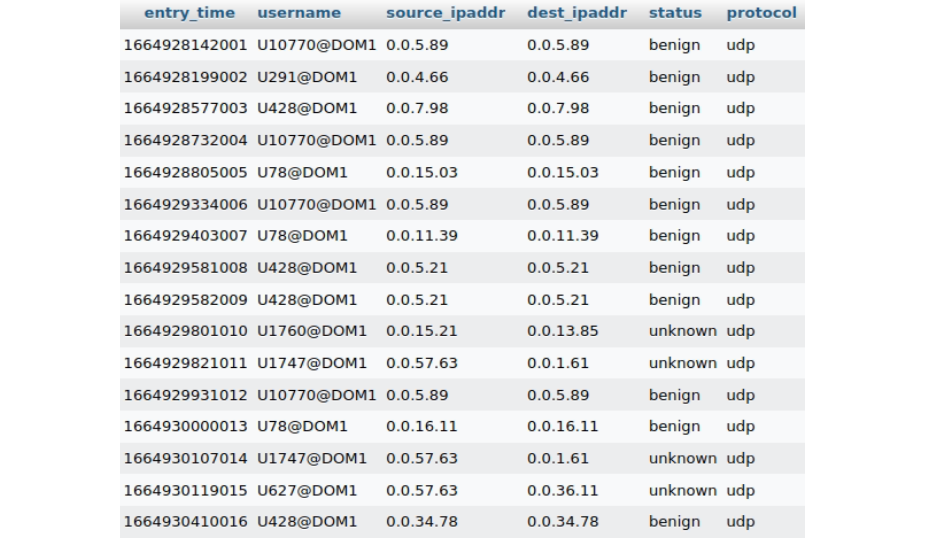
To load the train and test data using Kestrel, we can save the data into a database shown in the previous blog post. For example, we can have a table with five columns, as represented in Fig. 2.

The data stored in the database can be read using the STIX-shifter data source interface. We can load the data in the same way as the previous Kestrel analytics to detect lateral movement using the following commands. For further information, you can refer to my previous blog post.
users = GET user-account FROM stixshifter://database WHERE [user-account:user_id != null]

connections = FIND network-traffic LINKED users

connections_obs = ADDOBSID (connections)

users_obs = ADDOBSID (users)

observations = GET observed-data FROM stixshifter://database WHERE [user-account:user_id != null]
How to build and apply the Kestrel analytics?
This Kestrel analytics is available here. Before applying it, you need to download and build it using the following commands.
$ git clone https://github.com/opencybersecurityalliance/kestrel-analytics/Graph\ Learning-based\ Lateral Movement\ Detection.git

$ docker build -t kestrel-analytics-detect_lm .
After building the Kestrel analytics and reading the information stored in the database, we can apply the Kestrel analytics on variables observations and tables users_obs and connections_obs, respectively. This analytics takes two input parameters. The first one is called walkLength which represents the maximum length of the random walks during Phase 2, and the second one is called classifier, which can be set to either svm, knn, logisticRegression, xgboost, or randomforest. For more details, please see the following line of code.
APPLY docker://detect_lm ON observations, users_obs, connections_obs WITH walkLength=3, classifier=xgboostOur Kestrel analytics modifies variable observations by adding five attributes, called “destination”, “source”, “status”, and “user_id” to all entities. After these modifications, each entity will show an authentication request for which its status in terms of being malicious or benign is represented by the value of attribute status of the entity.
Leila Rashidi is a postdoctoral fellow at the Canadian Institute for Cybersecurity (CIC), University of New Brunswick (UNB), Canada. She currently leads a team at CIC, working on user entity behavior analysis in collaboration with IBM. Her research focuses on the cybersecurity and performance evaluation.


